Publication Information: Last Updated: February 26, 2026 | Read Time: 10 minutes |
The national average is $209 a month. But where you live, how old you are, and what’s on your driving record can move that number by hundreds of dollars in either direction. Here’s everything you need to know.
At A Glance – 2026 National Averages
| Full Coverage (National Average) | ~$209/month — ~$2,513/year |
| Liability Only (Minimum Coverage) | ~$130/month — ~$1,556/year |
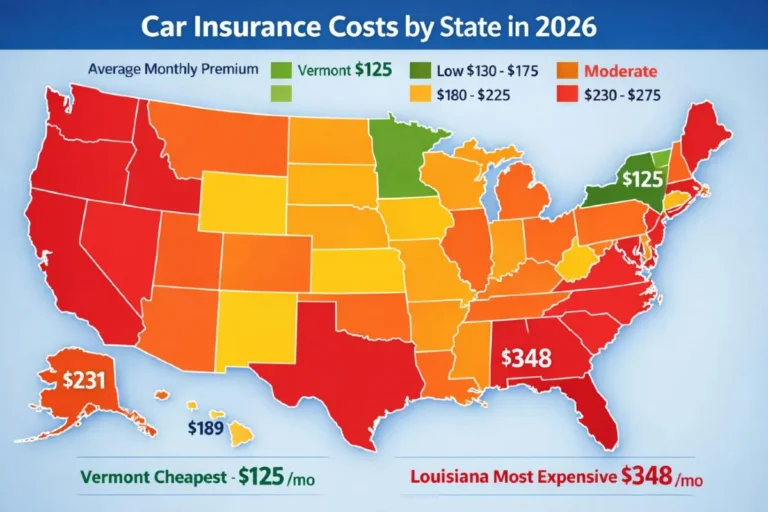
| Cheapest State (Vermont) | ~$125/month — ~$1,504/year |
| Most Expensive State (Louisiana) | ~$348/month — ~$4,180/year |
| Average After DUI | ~96% higher than standard rate |
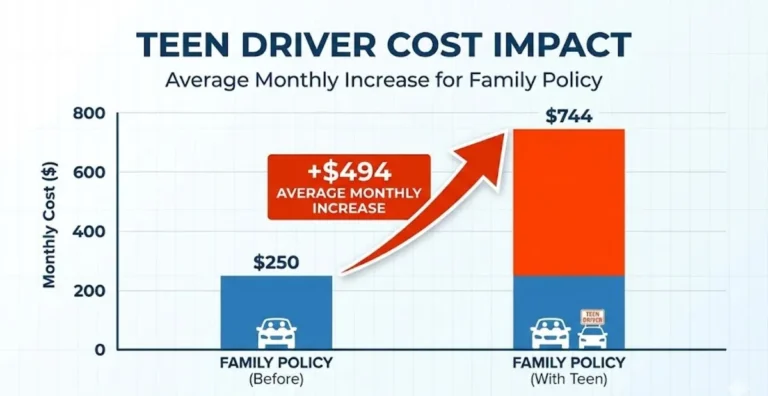
| Average for Teen Drivers | ~$494/month on a family policy 43% total premium increase since 2021 |
Overview
Car Insurance In America Right Now: The Honest Picture
If you’ve opened a car insurance renewal letter recently and had to sit down for a minute, you’re not imagining things. Car insurance in the United States has gotten significantly more expensive over the past several years — and while 2025 brought some welcome relief for many drivers, the full story is more complicated than any single headline suggests.
The national average cost of full coverage car insurance in 2026 sits at approximately $209 per month, or $2,513 per year, according to data compiled from CarInsurance.com, Bankrate, and Experian. For liability-only minimum coverage, the national average is roughly $130 per month, or $1,556 per year. But here’s the thing about those “national average” figures: they’re almost meaningless in isolation. The driver in Burlington, Vermont paying $125 a month and the driver in New Orleans, Louisiana paying $348 a month are both contributing to that same national average — yet their experiences are completely different.
What you actually pay depends on a staggering number of variables: your state, your ZIP code, your age, your gender (in most states), your credit score, your driving history, the car you drive, how many miles you put on it annually, and which insurance company you happen to call. Get all of those factors wrong, and you could easily pay twice as much as someone sitting next to you at a stoplight driving the same car.
This guide breaks all of it down with real 2026 numbers — not estimates from three years ago, not averages that don’t reflect your situation. The goal is simple: by the time you finish reading this, you’ll know exactly where you stand, why you’re paying what you’re paying, and what realistic steps you can take to pay less.
What Happened To Car Insurance Prices Between 2021 And 2026
Before we get into where rates are today, it’s worth understanding how we got here — because the recent history of car insurance pricing in America is genuinely dramatic.
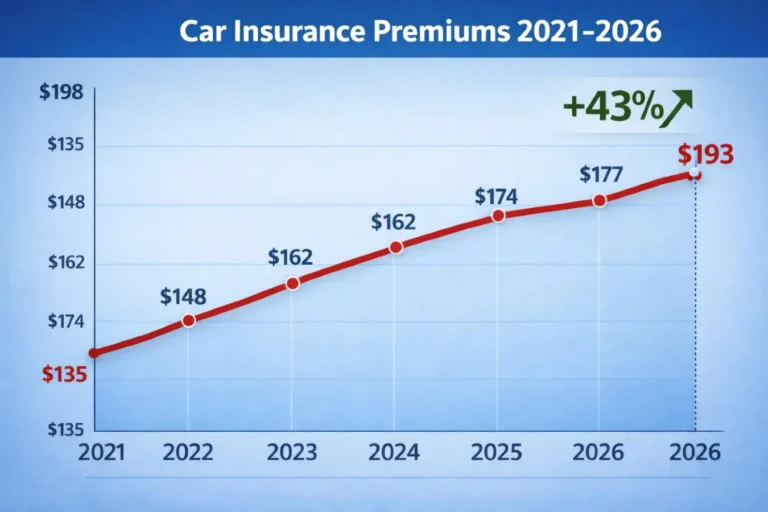
Between 2021 and the end of 2024, the national average cost of full coverage car insurance increased by a staggering 43%, according to Insurify’s 2026 American Driver Report. That’s not a typo. Forty-three percent in roughly three years. To put it in dollar terms: a driver who was paying $1,500 a year for full coverage in 2021 might have found themselves paying $2,150 or more by late 2024 — for the exact same policy, the exact same car, with no accidents and no tickets.
What caused it? Several things happening simultaneously. Vehicle repair costs exploded as supply chain disruptions made parts harder to source and technician labor more expensive. Replacement vehicle costs surged during the semiconductor shortage and post-pandemic inventory crunch, meaning total-loss claims cost insurers dramatically more to settle. Severe weather events — particularly Hurricanes Helene and Milton in late 2024, which reportedly damaged or destroyed an estimated 347,000 vehicles — generated catastrophic losses that insurers had to price into future premiums. And inflation across the board pushed up everything from glass replacement to medical care for accident injuries.
The good news: 2025 brought the first meaningful relief most American drivers had seen in years. National average premiums fell roughly 6% in 2025, with 39 states seeing rates decline. Some states saw dramatic drops — Wyoming’s rates fell 30%, and Iowa and Arkansas each saw decreases exceeding 20%. Most drivers across the country either held steady or paid somewhat less than they had in 2024.
The less-good news: Insurify projects a 1% increase in the national average for 2026, and rates are expected to tick upward in 35 states. The relief wasn’t evenly distributed going down, and it won’t be evenly distributed going back up either. If you live in a high-density, high-risk state, the 2025 reprieve may have barely reached you — and 2026 may bring another increase.
Section 1: How Much Is Car Insurance In Each State?
The State You Live In Matters More Than Almost Anything Else
Here’s a fact that surprises most people: your state of residence is one of the single largest factors in determining your car insurance premium — often more impactful than your driving record, your age, or the car you drive. Insurance is regulated at the state level, which means coverage requirements, pricing rules, lawsuit environments, and risk profiles vary enormously from one state to the next.
The difference between the cheapest and most expensive states right now is remarkable. Vermont drivers pay an average of just $1,504 per year for full coverage — roughly $125 a month. Louisiana drivers pay an average of $4,180 per year — roughly $348 a month. That’s a gap of nearly $2,700 per year for the same type of policy. Over five years, that’s over $13,000 just because of where you happen to live.
The 5 Cheapest States For Car Insurance In 2026
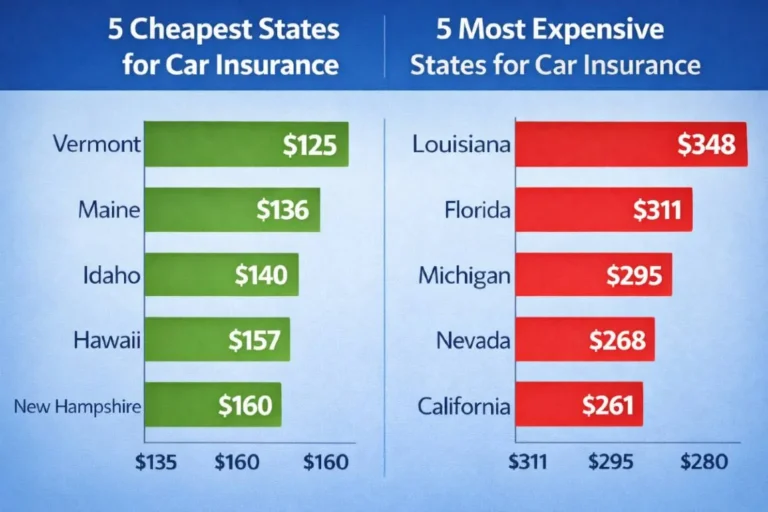
Vermont — $1,504/year ($125/month)
Vermont consistently ranks as the cheapest state in the country for car insurance. Low population density means less traffic and fewer accidents. The state has low rates of vehicle theft and relatively mild weather compared to other northeastern states. The result is fewer claims, and fewer claims means lower premiums.
New Hampshire — $1,650/year ($138/month)
New Hampshire is unique in that it’s the only state in the country that doesn’t legally require car insurance. Despite that, most drivers carry it, and because the state has relatively few uninsured motorists causing uncovered damage, the overall risk pool stays manageable. Low accident rates and a rural road environment keep premiums competitive.
Maine — $1,701/year ($142/month)
Maine offers some of the lowest premiums in the country thanks to low traffic density, relatively low crime rates, and an environment that doesn’t generate the kind of catastrophic weather claims seen in Gulf Coast or tornado-prone states.
Hawaii — $1,721/year ($143/month)
Hawaii is expensive for almost everything — except car insurance. The state prohibits insurers from using credit scores as a pricing factor, which removes one of the most significant premium inflation drivers used in other states. Low accident rates and low uninsured motorist numbers keep the overall cost down.
Ohio — $1,739/year ($145/month)
Ohio consistently ranks among the cheapest states for car insurance thanks to a combination of moderate traffic, reasonable repair costs, and a competitive insurance market with many providers competing for business.
The 5 Most Expensive States For Car Insurance In 2026
Louisiana — $4,180/year ($348/month)
Louisiana has ranked as one of the most expensive states for car insurance for years, and the reasons are well-documented: high accident rates, a legal environment that generates significant litigation around insurance claims (making payouts more expensive), frequent severe weather events including flooding and hurricanes, and high rates of uninsured drivers. If you live in Louisiana, you are statistically in one of the highest-risk insurance environments in the country.
Florida — $3,852/year ($321/month)
Florida’s insurance market is genuinely difficult for everyone — insurers and consumers alike. The state has one of the highest uninsured motorist rates in the country, at roughly 20.4% of drivers. Heavy hurricane exposure generates massive comprehensive claims. Dense traffic in corridors like Miami, Tampa, and Orlando produces high accident frequencies. And Florida has historically struggled with insurance fraud, particularly related to personal injury protection claims, which inflates costs across the board.
Washington, D.C. — $4,017/year ($335/month)
The District of Columbia holds the dubious distinction of having the highest average full-coverage car insurance rates in the country, according to Insurify data. Urban density, high repair costs, significant traffic congestion, and a high cost of living all contribute. D.C. also saw one of the largest single-year premium increases in 2025 — up 18% — despite the national trend toward lower rates.
Nevada — $3,284/year ($274/month)
Nevada’s problem is concentrated: much of the state’s population lives in the Las Vegas metro area, which has some of the most congested roads in the American West. High traffic volumes produce high accident frequencies, and high claim rates mean high premiums. Nevada also has elevated vehicle theft rates, which pushes comprehensive coverage costs upward.
Colorado — $3,222/year ($268/month)
Colorado’s insurance costs are shaped by two dominant forces: increasingly severe hailstorms that generate enormous numbers of comprehensive claims (Colorado is one of the most hail-prone states in the country), and rapidly rising auto repair costs in a state where the cost of living has climbed steeply over the past decade. Colorado has seen significant insurer losses in recent years, and those losses have been passed directly to consumers.
Section 2: What Affects Your Car Insurance Rate?
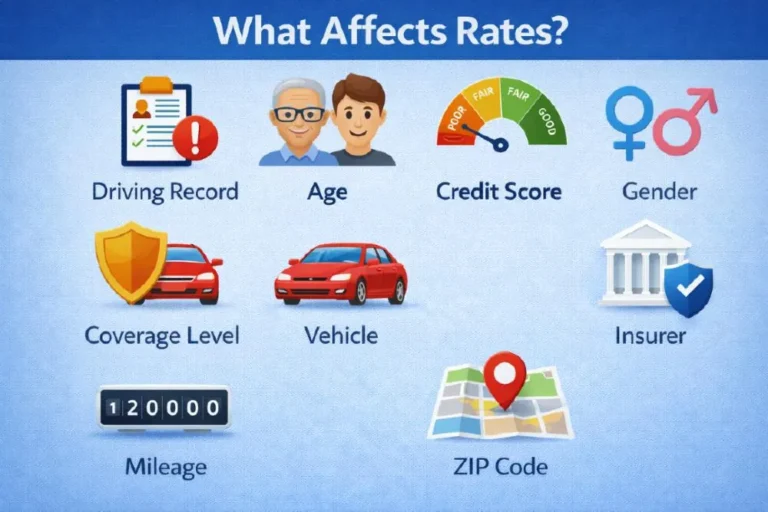
The 9 Factors That Determine What You Pay
Understanding how insurance companies calculate your premium is genuinely useful — not just as trivia, but because knowing what they’re measuring gives you a roadmap for what you can and can’t control. Here’s how each major factor works in practice.
Your Driving Record
This is the factor with the most direct impact on your day-to-day premium, and it’s also the one you have the most control over over time. Insurers look at your record as evidence of how likely you are to file a claim in the future. The math they apply to violations is unambiguous.
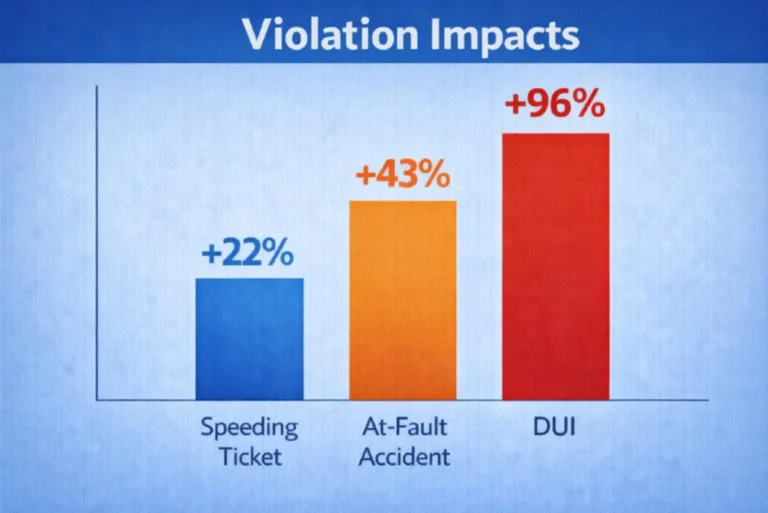
A single speeding ticket raises the average driver’s premium by approximately 22% over the standard clean-record rate. That translates to roughly an extra $460–$550 per year on a full-coverage policy near the national average.
An at-fault accident is more serious. The average monthly full-coverage payment jumps from $225 to approximately $322 after an at-fault accident — a 43% increase that can persist on your record for three to five years depending on your state and insurer.
A DUI conviction is in a category of its own. Drivers with a DUI on their record pay an average of 96% more for car insurance — essentially doubling their premium. In high-cost states like Michigan, a DUI can push a full-coverage premium to over $600 per month. The conviction typically affects your rates for five to ten years.
Your Age
Young drivers pay dramatically more than middle-aged drivers, and the data behind that pricing is straightforward: inexperienced drivers have significantly higher accident rates. A 16-year-old male added to a family policy brings the average annual cost for that policy to approximately $5,936, according to CNBC Select data from late 2025. That’s nearly $500 per month for the family’s coverage.
Rates typically peak in the late teens, drop gradually through the 20s, and reach their lowest point somewhere in the 50s and early 60s. After the mid-70s, premiums tend to rise again as reaction time and vision changes begin to statistically correlate with higher accident risk.
Your Credit Score
In 45 states, your credit score is a legal and commonly used factor in setting car insurance rates. Insurers have found through actuarial data that credit score correlates with claim likelihood — lower credit scores predict higher claim frequencies, regardless of driving record.
The impact is substantial. Drivers with poor credit pay an average of 76% more for full-coverage car insurance than drivers with good credit. That’s roughly in the same range as having a DUI. If you’re in a state that allows credit-based pricing (which is most of them — California, Hawaii, Massachusetts, and Michigan are the main exceptions), improving your credit score is one of the most powerful premium-reduction tools available to you.
Your Coverage Level
There are two basic approaches to car insurance coverage in America:
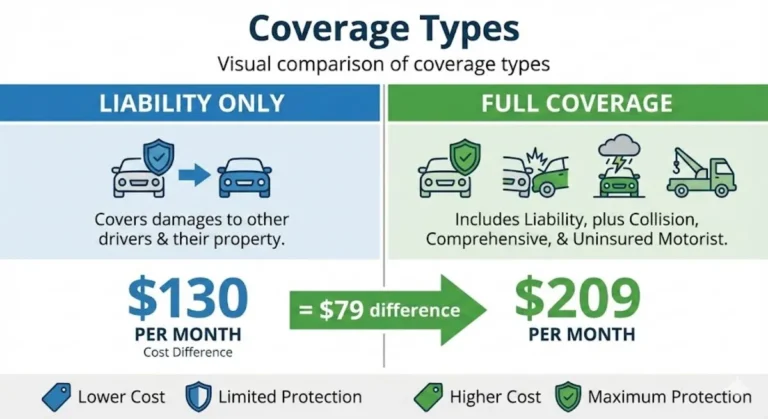
Liability only (minimum coverage): This pays for damage and injuries you cause to other people and their property. It does not cover your own vehicle. Every state except New Hampshire legally requires some minimum level of liability coverage. The national average cost is approximately $130 per month.
Full coverage: This adds comprehensive coverage (theft, weather damage, fire, falling objects) and collision coverage (damage to your own car in an accident) on top of liability. The national average is approximately $209 per month.
Whether full coverage is worth the extra cost depends primarily on one factor: the value of your car. A common rule of thumb is that if your vehicle is worth less than ten times your annual comprehensive and collision premium, you may be better off dropping down to liability only and self-insuring the vehicle’s value. A ten-year-old car worth $5,000 with a $600 annual collision premium is borderline. A three-year-old car worth $28,000 is not.
Your Vehicle
The car you insure is priced on several dimensions simultaneously. Insurers look at how expensive the vehicle is to repair (a car with expensive sensors and cameras in every bumper costs dramatically more to fix after a minor collision than an older vehicle with a simple steel bumper). They look at the vehicle’s safety ratings, which predict injury severity in accidents. They look at the car’s theft rate — some models are stolen far more frequently than others. And they look at the vehicle’s power and performance characteristics, which correlate with accident risk.
In general terms: luxury vehicles, high-performance cars, large SUVs with complex safety systems, and vehicles with poor safety ratings all cost more to insure. Mainstream sedans and minivans with high safety ratings and low theft rates cost less.
Your Gender
In 43 states, insurers are legally permitted to use gender as a pricing factor. Men — particularly young men — pay higher average premiums because actuarial data shows they are statistically more likely to engage in risky driving behaviors, including speeding and driving under the influence. On a national blended average, men pay roughly $2,308 per year for car insurance while women pay approximately $2,285, according to Experian data. The difference narrows significantly as drivers age past 25.
Your Annual Mileage
More miles on the road equals more exposure to accident risk, and insurers price that accordingly. The average American drives approximately 14,000 to 15,000 miles per year. If you drive significantly less — say, under 7,500 miles annually — many insurers offer low-mileage discounts or usage-based insurance programs that can meaningfully reduce your premium. If you drive significantly more (long daily commutes, frequent road trips), expect to pay above the standard rate.
Your ZIP Code
This one surprises people. Your insurance doesn’t just vary by state — it varies by ZIP code within your state, and sometimes the differences are dramatic. In 2025, the most expensive city in the country for car insurance was Brooklyn, New York, with an average full-coverage premium of $6,728 per year. The cheapest city in the country was Essex Junction, Vermont, at $1,393 per year. Both cities are in the northeastern United States. The difference is entirely in local risk factors: accident frequency, theft rates, traffic density, and medical cost environments.
Your Insurer
This one is underappreciated. Two different insurance companies, looking at the exact same driver profile, will often come up with dramatically different premium quotes. In 2025, the spread between the cheapest and most expensive major insurers for the same profile exceeded $1,600 per year in many cases. USAA (available only to military members, veterans, and their families) and Geico consistently ranked among the lowest-cost options nationally. Farmers and Allstate averaged over $3,000 annually for full coverage in 2025. Shopping your policy matters enormously.
Section 3: Types Of Coverage Explained
What You’re Actually Buying
A lot of confusion around car insurance costs stems from not fully understanding what each type of coverage does — and therefore not being able to evaluate whether you’re overpaying for protection you don’t need or underinsured against risks that could genuinely hurt you financially.
Liability Insurance
This is the foundation of every car insurance policy, and the only type required in nearly every state. Liability coverage pays for damage and injuries you cause to other people when an accident is your fault. It does not protect your own car or cover your own medical expenses.
Liability limits are expressed as three numbers — for example, 25/50/25. That means $25,000 per injured person, $50,000 total per accident for bodily injury, and $25,000 for property damage. State minimums vary widely, and most insurance professionals will tell you the minimums are dangerously low in most states. A single serious accident with injuries can easily exceed $50,000 in medical bills alone. Buying only the state minimum is the cheapest option short-term, but it can expose you to significant personal financial liability if you’re at fault in a serious crash.
Collision Coverage
Collision coverage pays to repair or replace your own vehicle when you’re involved in an accident with another car or a stationary object, regardless of fault. The cost depends heavily on your deductible — the amount you agree to pay out of pocket before insurance kicks in. Raising your deductible from $200 to $500 can reduce your collision and comprehensive premium by as much as 30%, according to the Insurance Information Institute.
Comprehensive Coverage
Comprehensive covers damage to your vehicle from events that aren’t accidents: theft, fire, flood, hail, falling trees, hitting an animal, and vandalism. In high-theft areas or states with significant weather risk (tornado country, hurricane states, hail-prone regions like Colorado), comprehensive coverage is particularly valuable. In low-risk environments, it’s worth evaluating against your vehicle’s value.
Uninsured And Underinsured Motorist Coverage
This coverage protects you when you’re hit by a driver who either has no insurance or doesn’t have enough insurance to cover your losses. As of 2023, roughly 14% of American drivers were uninsured nationally, with some states like Florida exceeding 20%. In those environments, uninsured motorist coverage isn’t optional paranoia — it’s essential financial protection.
Personal Injury Protection (PIP)
Required in no-fault states, PIP covers your medical expenses and sometimes lost wages after an accident, regardless of who was at fault. States with mandatory PIP requirements — Florida, Michigan, New York, New Jersey, and others — generally have higher minimum insurance costs than at-fault states.
Section 4: How To Lower Your Car Insurance Premium
Strategies That Actually Work In 2026
The good news about car insurance costs is that while many factors are outside your control — your state, your age, historical weather patterns — several of the most significant factors are things you can actively manage. Here’s what actually moves the needle.
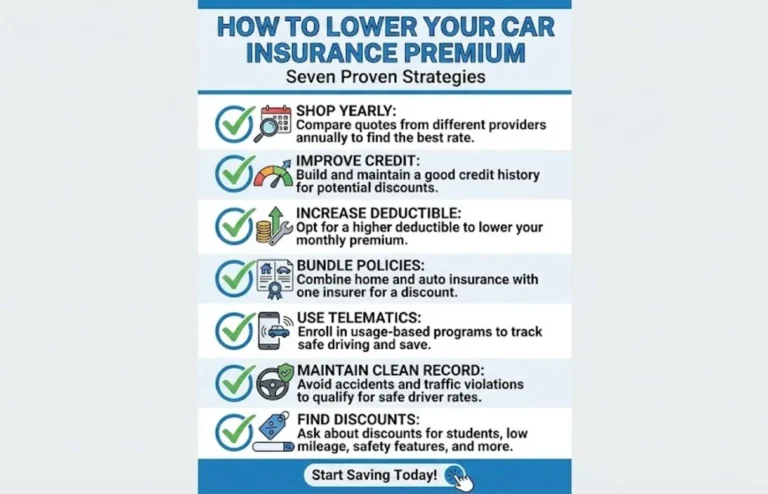
Shop Your Policy Every Year
This is the single most effective thing most Americans could do right now, and most of them don’t do it. Insurance companies are not loyal to you the way you might be loyal to them. Rates change every year based on each company’s internal profitability calculations, their reinsurance costs, and their competitive strategy in your market. A company that was cheapest for your profile two years ago may not be cheapest today — and you’ll never know unless you get quotes from competitors.
The Insurance Information Institute recommends getting quotes from at least three different companies every time your policy comes up for renewal. Given that premium differences between companies for identical profiles can exceed $1,500 per year, spending 45 minutes getting comparison quotes is among the highest-value time investments available to a consumer.
Improve Your Credit Score
In states where credit-based pricing is permitted, this is one of the highest-leverage moves available to most drivers. Moving from a poor credit tier to a fair credit tier can cut your premium by 30–40% in some cases. Moving from fair to good, and from good to excellent, produces progressively smaller but still meaningful savings. Paying bills on time, reducing credit utilization, and reviewing your credit report for errors are the standard playbook — but they genuinely work, and they work for car insurance as much as for mortgages and credit cards.
Increase Your Deductible
If you have sufficient emergency savings to cover a higher out-of-pocket expense after an accident, raising your deductible from $200 to $500 or $1,000 can reduce your collision and comprehensive premiums meaningfully. The trade-off is real: you’re accepting more financial exposure in exchange for lower monthly costs. Make this decision based on what you could realistically afford to pay out of pocket on a bad day.
Bundle Your Policies
Most major insurance companies offer significant discounts — sometimes 10–20% — when you purchase both your auto and homeowners or renters insurance from the same company. If you’re currently carrying those policies separately with different insurers, call each and ask for bundle quotes. The savings are often substantial.
Take Advantage Of Telematics Programs
Usage-based insurance (UBI) programs — offered by most major carriers under names like Snapshot (Progressive), DriveWise (Allstate), and Drive Safe & Save (State Farm) — use an app or device to monitor your actual driving behavior: hard braking, speed, time of day, and mileage. If you’re a genuinely careful driver who doesn’t commute in heavy traffic at rush hour, these programs can save 10–30% on your premium. For young drivers specifically, telematics is often the fastest path to meaningful premium reductions.
Maintain A Clean Driving Record
The most obvious point is also the most important. A single speeding ticket can add $460–$550 to your annual premium for three to five years. Over five years, that one ticket costs you somewhere between $2,300 and $2,750 in additional insurance premiums — on top of the fine itself. Safe driving is quite literally the most valuable financial discipline available to anyone who drives.
Look For Discounts You’re Not Using
Most people are unaware of the full range of discounts their insurer offers. Common discounts that are frequently overlooked include: low-mileage discounts, good student discounts (for drivers under 25 with strong academic records), military and veteran discounts, professional association discounts, multi-car discounts for households insuring more than one vehicle, and paperless billing discounts. Call your insurer and ask them to walk through every available discount category against your profile. It takes twenty minutes and often uncovers savings.
Section 5: Special Situations
What You Pay In Non-Standard Circumstances
Teen Drivers
Adding a 16-year-old to a family policy is expensive — there’s no way to sugarcoat it. The average annual cost of a policy with two adults and a 16-year-old male reached approximately $5,936 in late 2025. The practical strategies to manage this cost include: keeping the teen on the family policy rather than a separate policy (almost always cheaper), enrolling them in a telematics program, insuring them on the household’s oldest and least-valuable vehicle, and pursuing every good-student discount available.
Senior Drivers
Rates typically start rising again in the mid-70s as insurers factor in age-related risk increases. Many insurers offer mature driver discounts for completing defensive driving courses specifically designed for older drivers — these are worth pursuing if you’re in this demographic. AARP partners with The Hartford to offer insurance products specifically designed for drivers over 50, and the rates are often competitive.
High-Risk Drivers
If you have multiple violations, a DUI, or several at-fault accidents, you may find yourself in the non-standard or high-risk insurance market. SR-22 filing requirements (a certificate proving minimum insurance coverage, required by most states after serious violations) typically add 14% to your base premium on top of the rate increase from the underlying violation. Companies like Progressive, Dairyland, and Acceptance Insurance specialize in high-risk drivers and are worth comparing if your profile has significant blemishes.
Electric Vehicle Drivers
Insuring an electric vehicle typically costs more than insuring a comparable gasoline-powered vehicle. EVs have higher purchase prices, more expensive repair costs (particularly for battery systems and the specialized labor required to work on them), and a more limited pool of qualified repair facilities in many areas. Tesla vehicles in particular have historically carried premium insurance rates. As the EV market matures and repair infrastructure improves, this gap is expected to narrow — but for now, factor in higher insurance costs when evaluating the total ownership cost of an electric vehicle.
Section 6: What’s Coming In 2026 And Beyond
The Tariff Question — A Real Wildcard
One factor that wasn’t part of the conversation in previous years but is very much part of it now: import tariffs on auto parts. New tariff structures that took effect in 2025 — with potential increases as high as 70% on components from certain trading partners — have not yet fully worked their way through the auto repair cost supply chain. When repair costs rise, insurance claims cost more to settle. When claims cost more to settle, insurers raise premiums.
Insurify’s analysts explicitly flag tariff impacts as the major uncertainty in their 2026 forecast. If import tariffs push auto parts prices significantly higher through 2026, the projected 1% national average increase could end up being considerably larger — particularly in states that already have elevated repair and claims costs.
Climate Risk Is Becoming an Insurance Issue
The increasing frequency and severity of weather events — hail in the Mountain West, flooding in the Gulf Coast, wildfire smoke in the Pacific states — is reshaping insurance pricing in ways that are just beginning to be felt by consumers. Some high-risk areas are already seeing insurers exit the market or impose coverage restrictions. The broader pattern of climate-driven claims is a structural cost pressure that isn’t going away.
The Long-Term Affordability Gap
Perhaps the most significant finding in Insurify’s 2026 report is the widening gap between expensive and affordable states. While rates fell in lower-cost, lower-risk states like Wyoming and Iowa in 2025, they continued rising in already-expensive states like New Jersey (up 20%), Washington D.C. (up 18%), and Rhode Island (up 13%). The insurance affordability gap between where you can afford to drive and where you happen to live is becoming a real policy issue in American cities.
FAQ
Q: How much does car insurance cost per month in the USA in 2026?
A: The national average cost of full coverage car insurance is approximately $209 per month in 2026, based on data from CarInsurance.com and Bankrate. Liability-only minimum coverage averages about $130 per month nationally. Your individual rate will vary based on your state, driving record, age, credit score, vehicle, and chosen insurer.
Q: What is the cheapest state for car insurance in 2026?
A: Vermont has the lowest average full-coverage car insurance rates in the country at approximately $1,504 per year ($125/month), according to multiple 2026 analyses. New Hampshire ($1,650/year), Maine ($1,701/year), and Hawaii ($1,721/year) round out the lowest-cost states.
Q: What is the most expensive state for car insurance in 2026?
A: Louisiana has the highest average full-coverage car insurance rates nationally at approximately $4,180 per year ($348/month). Washington D.C. also exceeds $4,000 annually, and Florida averages $3,852 per year. High accident rates, weather exposure, litigation environments, and concentrations of uninsured drivers drive up costs in these areas.
Q: Did car insurance go up or down in 2025?
A: Car insurance premiums fell nationally in 2025 — the first meaningful decrease for most drivers since before the COVID-19 pandemic. The national average fell approximately 6%, with 39 states seeing rate reductions. Some states saw dramatic drops (Wyoming -30%, Iowa and Arkansas each more than -20%). However, 10 states saw rates increase in 2025, including New Jersey (+20%), Washington D.C. (+18%), Rhode Island (+13%), and Michigan (+12%).
Q: How much does car insurance go up after a ticket or accident?
A: A single speeding ticket raises the average full-coverage premium by approximately 22%. An at-fault accident raises the average monthly payment from $225 to roughly $322 — a 43% increase. A DUI conviction nearly doubles the average premium, raising it approximately 96%. These increases typically persist on your record for three to ten years depending on the violation and your state.
Q: Does credit score affect car insurance rates?
A: Yes, in 45 U.S. states, credit score is a legally permitted and commonly used factor in setting car insurance premiums. Drivers with poor credit pay an average of 76% more than drivers with good credit for the same coverage. California, Hawaii, Massachusetts, and Michigan prohibit the use of credit-based pricing in insurance.
Q: What is the difference between full coverage and liability-only car insurance?
A: Liability-only insurance covers damage and injuries you cause to other people and their property. It does not cover your own vehicle. Full coverage adds collision (damage to your vehicle in an accident) and comprehensive (theft, weather, vandalism, and other non-collision damage). The national average for liability-only is about $130/month; full coverage averages about $209/month.
Q: How can I lower my car insurance rates?
A: The most effective strategies include: shopping your policy with multiple insurers every renewal cycle, improving your credit score, raising your deductible if you have adequate savings, bundling auto and home insurance with one carrier, enrolling in a usage-based or telematics program, and maintaining a clean driving record. In states where credit-based pricing is allowed, credit improvement often has the largest single impact on premiums.
The Bottom Line
Car insurance in America costs more than it ever has historically — even after the modest relief of 2025. The national average of $209 per month for full coverage is a real number that real families have to plan for, and in states like Louisiana, Florida, and Washington D.C., the cost isn’t $209 a month — it’s closer to $300, $350, or more.
But “average” rarely means anything useful when it comes to insurance. The range of what people actually pay — from $125 a month in rural Vermont to nearly $560 a month in parts of Michigan after a DUI — is so wide that the only meaningful strategy is to understand exactly which factors are affecting your specific rate, and then systematically address the ones you can control.
Shop every renewal. Work on your credit. Keep your record clean. Use telematics if you’re a careful driver. And never assume the company you’ve been with for five years is still giving you the best available rate — because statistically, they probably aren’t.
Editorial Note
This article was written and reviewed in February 2026. All rate data is sourced from Insurify’s 2026 American Driver Report, Experian’s January 2026 automotive insurance data, Bankrate, CarInsurance.com, U.S. News & World Report, and ValuePenguin rate analyses current as of early 2026. Rates are national and state averages intended for informational and educational purposes. Your individual premium may differ significantly from any figure cited here. Always compare personalized quotes from multiple licensed insurers before purchasing or renewing a policy. This article does not constitute insurance advice.


0 Comments